Difference between revisions of "Contrib:KeesWouters/plasticity"
Keeswouters (Talk | contribs) (→'''General procedure of the calculation''') |
Keeswouters (Talk | contribs) (→'''General procedure of the calculation''') |
||
| Line 25: | Line 25: | ||
[[image:Kw_res_vshape.png]] | [[image:Kw_res_vshape.png]] | ||
| − | In the figure the results | + | In the figure the results of four load cycles are given: the maximum displacement of each calculation is 0.080, 0.085, 0.095 and 0.100 mm. The plastic deformation at a load free construction after the load cycle is roughly 0.005, 0.009, 0.018 and 0.022 mm. <br/>Each dot in the curves indicate a output point of the calculation. In most case 21 points are given, these have been defined in the 'time' increment function. |
Revision as of 14:00, 12 August 2009
V shaped construction under plastic deformation
The V shaped is defined by an extrusion of a V shaped face.
-
 *
* 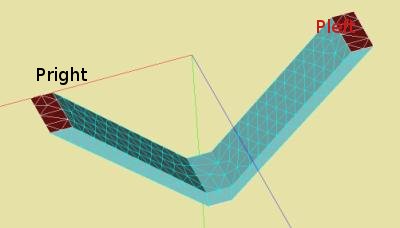


Three planes are defined in the geometry: Pleft and Pright for applyind boundary conditions (dx=dy=dz=0) and Pforce for defining a prescribed displacement in y direction.
The definition of the geometry as well as the meshing is given in the Python input file.
In the geometry module of Salome select File --> Load Script (or ctrl T) and thereafter the file: Media:kw_gm_vshape.zip.
General procedure of the calculation
The general procedure of the calculation is as follows:
- read the mesh
- apply the non linear material properties of the construction
- define the boundary conditions
- define the maximum load, in this case a maximum displacement at the plane Pforce
- define 'time' and 'load' increments: here we define an increase multiplication factor for the loads from 0 to 1, then constant during a small time and decreasing from 1 to 0 again.
- perform the analysis
- define results in a med-file for Salome, in this case, displacements, vonMises and plastic stresses
- print results in a file, notably the displacements of the plane Pforce and its corresponding forces.

In the figure the results of four load cycles are given: the maximum displacement of each calculation is 0.080, 0.085, 0.095 and 0.100 mm. The plastic deformation at a load free construction after the load cycle is roughly 0.005, 0.009, 0.018 and 0.022 mm.
Each dot in the curves indicate a output point of the calculation. In most case 21 points are given, these have been defined in the 'time' increment function.